Limited Time Offer Management & Reporting
End-to-end Foodservice Supply Chain
TL:DR
The Problem
Foodservice Promotion Managers spend most of their day in spreadsheets trying to find issues
The Solution
Create a Promotion Management tool to surface issues clearly leading to faster response time
The Impact
Daily time spent in promotion spreadsheets dropped to 0%, time spent on issues dropped by 30%
My Role
End-to-end Designer, User Researcher, UAT, and Beta Facilitator
Context: Company, Users, & Project
Company
Arrowstream is a Foodservice B2B Supply Chain Management SaaS product
Multi-persona platform with Brands, Distributors, and Suppliers utilizing different products
Complex and data-heavy, ingesting and mapping data from the distribution center feeds, supplier feeds, and user uploads
Helps users make critical decisions in their supply chain with focused reporting
Users
Users get attached to certain workflows and processes
Each brand has its own workflows and required data
Users prefer direct communication vis phone call or email over automated notifications
Project
These offers use a mix of promotion-specific and general items
Users are focused on:
Building up a stock of these items before a promotion launches
Maintaining inventory levels during a promotion
Tapering off inventory as a promotion ends to avoid overstock and financial exposure
This project is an additional paid-for product offering as an add-on to our core product
Project Scope: Team, Timeline, My Role & Constraints
Team & Timeline
-
PM, Product Marketing Manager, 5 engineers, 2 QA testers, and me
-
Q1 on Product Market Fit, Discovery, and User Research
-
Q2 on Ideation, Scoping, Design, and User Validation
-
Q3 on Development, QA, and UAT
-
Q4 Beta program
My Role
-
End-to-end design
-
Qualitative user research
-
Collaborative scoping of product requirements
-
Product design strategy
-
Experience design
-
Prototyping and Usability Testing
-
Dev Handoff
-
UAT and Beta Validation
Constraints
-
The scope did not include forecast creation or post-promotion analysis
-
Data ingestion was a manual upload using a template spreadsheet for V1
-
Diversity in brands' internal processes means some processes (Franchisee commitments, etc) happen outside the system for V1
Impact: Money Saved, Increased Productivity, & Thought Leadership
Saved Brands Money
-
Better management means less Overstock that a brand has to pay to deal with
-
Keeping steady inventory means less spent on unexpected transportation costs
Increased Productivity
-
Daily time spent on issues decreased by 30%
-
Time spent on creating internal reports throughout a promotion decreased 20%
Thought Leadership
-
Defined with users "what a succesful promotion looks like"
-
Created workshops for different brands to share insights, struggles and best practices
-
Published accompanying articles on Industry Best Practices for LTO Management
Discovery: User Needs, Data Constraints, & Design Feedback
10 External Brand Interviews
Goal: Understand brands' promotion forecasting, setup, management, and tracking processes
Aha! Moment: Promotion Managers are not forecasting; that is a separate persona
-
At what level are brands forecasting, and how are they generating that forecast?
-
Once a promotion starts, what does daily management look like?
-
What are the key indicators of concern during a promotion?
-
During and after a promotion, what kind of reports are generated, and what is the audience for those reports?
12 Internal Meetings
Goal: Understand how AS receives data from Distribution Centers, the limitations of our data streams, and the creation of metrics that accurately portray the indicators brands are interested in
Aha! Moment: We need to surface data "freshness" to a user at a glance
-
What is the cadence of data received?
-
What are the thresholds to pay attention to in our metrics?
5 Design Feedback Sessions
Goal: Receive brand feedback on mocks and show work completed in previous sprints
Aha! Moment: Users getting most excited about drill-in/easy context switching made that higher priority
-
Validate work and processes
-
Open up the discussion to different employee roles
Results: Users Top 3 Goals During A Promotion
Inventory Alerts
Alerts on Inventory thresholds and missing Purchase Orders (POs) to know when I need to reach out to Distribution Centers.
Financial Exposure
I want to know my Financial Exposure. How much money would I lose in unused items if my promotion was forced to end today? What is the variance between Real & Forecasted Usage, ?
Data Slicing & Reporting
I generate reports with different sections of data for a variety of external and internal users throughout the promotion.
Design: Focused on Management During A Promotion

Inventory Alerts
-
Inventory Alerts are for Item/DC and Item/Store groupings. The issues are sorted to the top, and are categorized by:
-
Out of Stock (Red) where the On Hand is less than or equal to zero
-
High Risk (Orange) where the estimated Run Out Date is before the Next Purchase Order Delivery Date
-
At Risk (Yellow) where there is either No Purchase Order placed or the estimated run-out date is before the 2nd or 3rd Purchase Order Delivery Date
-
No Alerts (Green): none of the conditions above are met
-
-
Count of days until estimated Run Out: Clicking on this gives you a deeper inventory view at that DC Location/Item Combo
-
Filter: A user can filter by promotional-only items, statuses, and DCs
-
All data can be exported with Filters applied for fast reporting
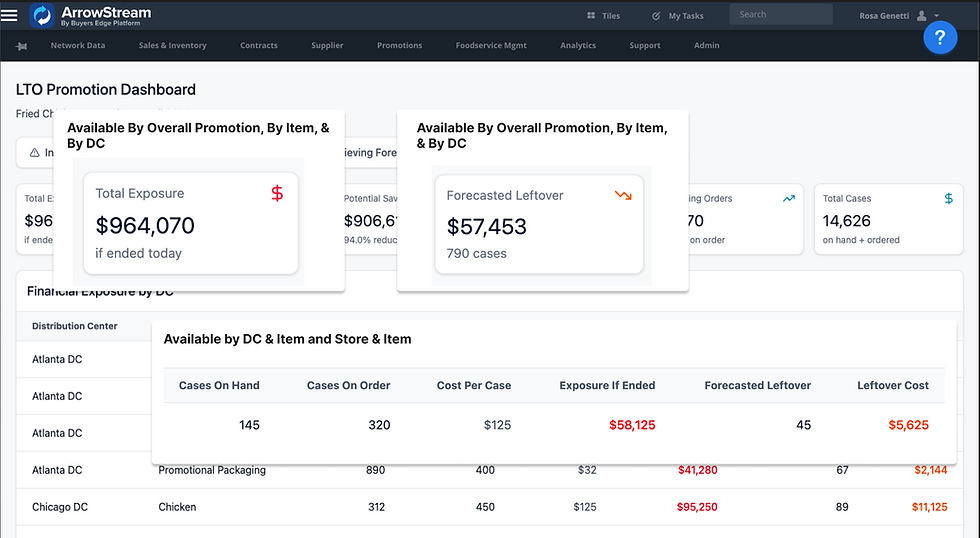
Financial Exposure
-
Total Exposure at all Distribution Centers across all Items if the promotion ended today, and Forecasted Leftover if the promotion continues performing against the forecast
-
Total Exposure at the listed Distribution Center across all Items based on Cases on Hand, Cases on Order, and the Cost Per Case.
-
All data can be exported with Filters applied
Beta Release: We launched a Beta with 6 brands, generating 4 upsells!
"This makes my morning check-in so much faster! I love being able to download the reports to send to the team to keep them up to date."
-Early Adopter
"I really like being able to tell what is current data and where I need to talk more to DCs to fill in gaps."
-Beta User
Sales identified a $1-3 million potential ARR based on our current brand customers.
Key Learnings: What I would do differently
1. Focus more on integrating with an OCR or spreadsheet mapper
For scalability being able to import any forecast type and not have to download, fill out, and upload our template.
2. Provide more Product Information and Documentation to Internal Teams
There have been a lot of questions on what is and isn't in scope, as well as future improvements on the roadmap by our AM and Sales team.
To fulfill our users' goal of Inventory Alerts, I designed a dashboard view that surfaces immediate issues.
Available during Phase 2, all this data can be exported into Excel
-
Inventory Alerts are for Item/DC and Item/Store groupings. The issues are sorted to the top, and are categorized by:
-
Out of Stock (Red) where the On Hand is less than or equal to zero
-
High Risk (Orange) where the estimated Run Out Date is before the Next Purchase Order Delivery Date
-
At Risk (Yellow) where there is either No Purchase Order placed or the estimated Run Out Date is before the 2nd or 3rd Purchase Order Delivery Date
-
No Alerts (Green): none of the conditions above are met
-
-
Count of days until estimated Run Out: Clicking on this gives you a deeper inventory view at that DC Location/Item Combo
-
Filter: A user can filter by promotional only items, statuses, and DCs

To fulfill our users' goal of Financial Exposure, I designed a dashboard view that tracks purchase orders and inventory.
Available during Phase 2, all this data can be exported into Excel
-
Total Exposure at all Distribution Centers across all Items if the promotion ended today, and Forecasted Leftover if the promotion continues performing against the forecast
-
Total Exposure at the listed Distribution Center across all Items based on Cases on Hand, Cases on Order, and the Cost Per Case.

To fulfill our users' goal of Data Slicing and Reporting, all DCs can be drilled into further. I also created a Dashboard to surface DCs underperforming their forecasts to quickly surface outliers.
Available during Phase 2, all this data can be exported into Excel
-
Key Insights generated by AI on which DCs are underperforming and potential remedial actions
-
Expected vs Actual Sales and Variance
